You haven't signed in yet, you can have a better experience after signing in
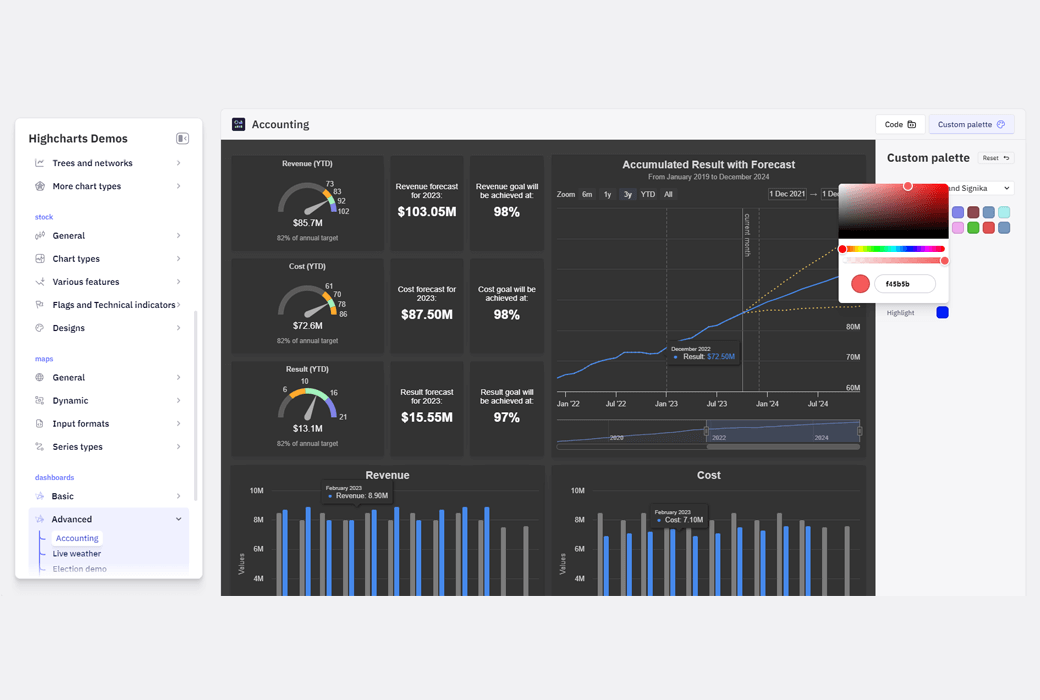
 Highcharts Dashboard Web Dashboard Data Chart Library Suite

Activity Rules
1、Activity time:{{ info.groupon.start_at }} ~ {{ info.groupon.end_at }}。
1、Activity time:cease when sold out。
2、Validity period of the Group Buying:{{ info.groupon.expire_days * 24 }} hours。
3、Number of Group Buying:{{ info.groupon.need_count }}x。
Please Pay Attention
1、Teamwork process: Join/initiate a Group Buying and make a successful payment - Within the validity period, the number of team members meets the activity requirements - Group Buying succeeded!
2、If the number of participants cannot be met within the valid period, the group will fail, and the paid amount will be refunded in the original way.
3、The number of people required and the time of the event may vary among different products. Please pay attention to the rules of the event.
Additional products
Highcharts Dashboards
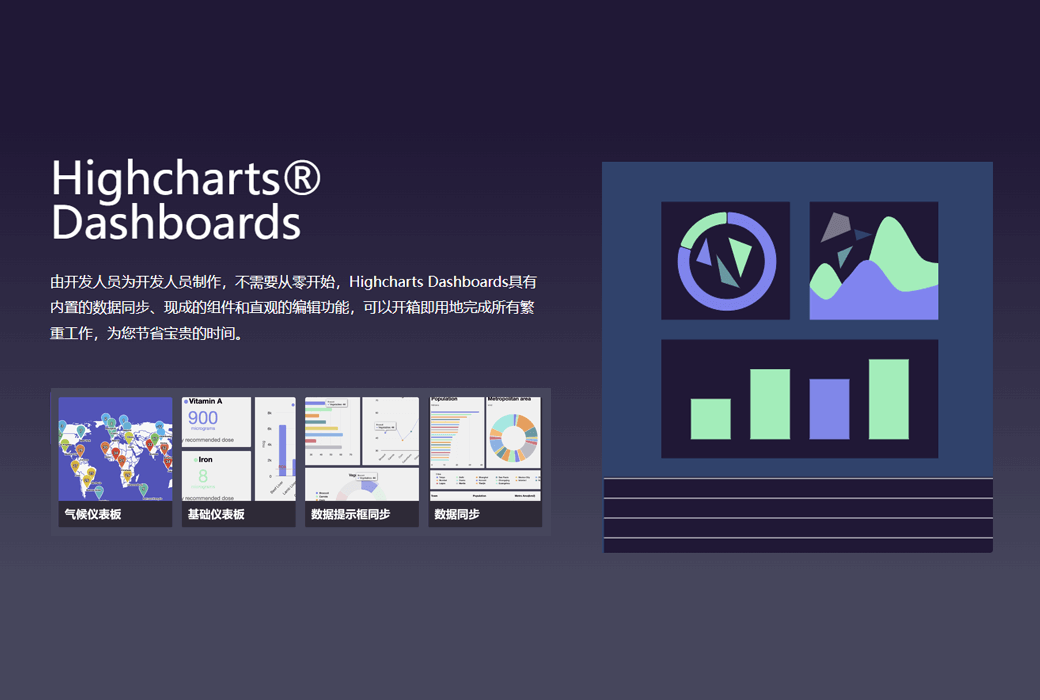
Highcharts Dashboards is a web-based dashboard development library that integrates data synchronization, pre made components, and fully customizable options, designed to simplify dashboard project development and save time. It is compatible with all Highcharts chart libraries and most major frameworks, providing flexible frameworks, pre built components, built-in data synchronization, and responsive layouts, supporting user customization and self hosting, ensuring data security.
Features of Highcharts Dashboards
- Integration with Highcharts
The Highcharts dashboard seamlessly integrates with all Highcharts data visualization libraries. Utilize all Highcharts chart methods and tools within the component to enhance the dashboard.
- Time saving framework
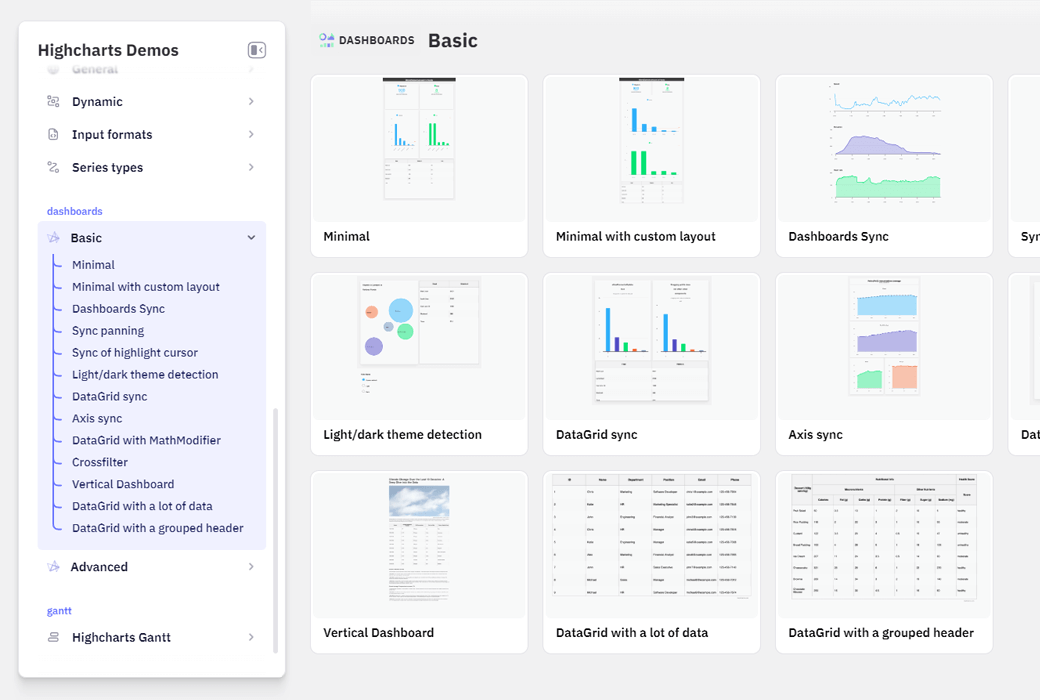
No need to waste time coding from scratch. Highcharts Dashboards completes all the heavy work right out of the box. Use our framework to easily set up a powerful, responsive, and accessible dashboard in just a few minutes. View our demo and setup documentation.
- Pre built components
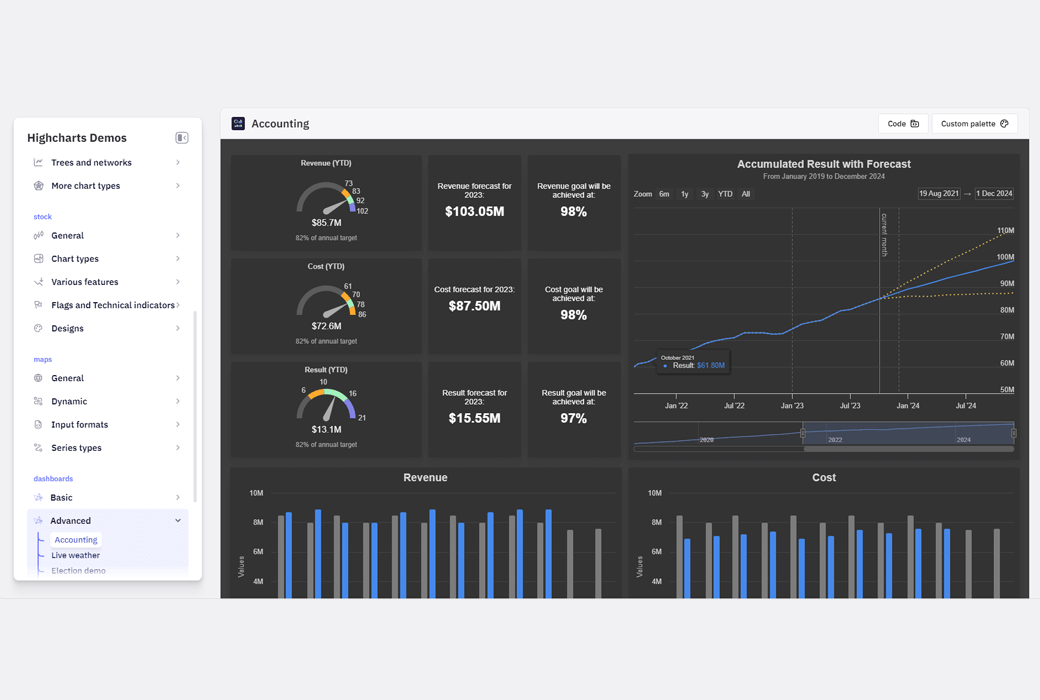
Highcharts Dashboards includes pre built charts, KPIs, and data grid components, all of which can be easily configured using the same JavaScript option structure as all Highcharts chart libraries. Not familiar with Highcharts? Our intuitive API and typing definitions can shorten the learning curve.
- Built in data synchronization
Use our dashboard data layer to load, process, and build your data. Any changes made to the data will be automatically synchronized between dashboard components without any additional work.
- Responsive out of the box use
Highcharts Dashboards are out of the box and optimized for display on various devices and screen sizes. Our dashboard layout engine is based on Flexbox, which ensures that when the dashboard container is resized, the component layout dynamically adjusts across all browsers.
- Completely customizable
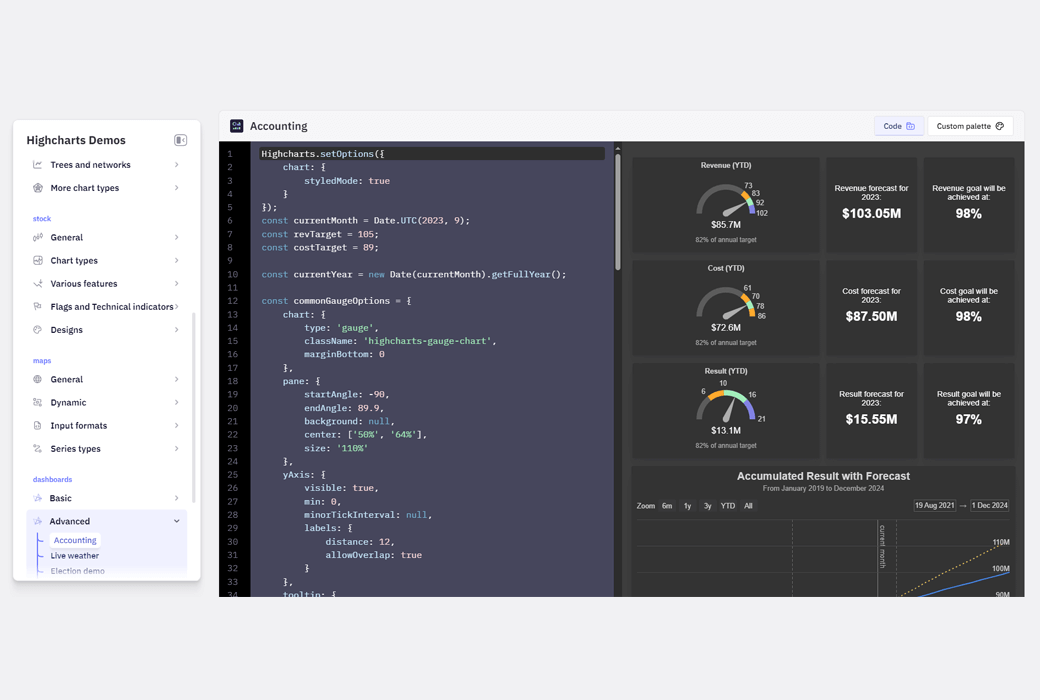
Create custom layouts, add custom HTML and media components. Even using different chart libraries (if necessary) is up to you. Our simple configuration options and variable driven CSS make customization fast and easy. There are no proprietary editors or hackers, you control the code.
- Safe choice
With Highcharts Dashboards, your data belongs to you. Unlike low code or no code dashboards that host data remotely, Highcharts Dashboards is a fully self hosted solution that poses zero risk to data integrity or privacy.
- Intuitive editing
Adjust dashboard elements without a code editor. By dragging and dropping to rearrange components, intuitively adjust row width and component size.
Characteristics of Highcharts
- Used in conjunction with your technology stack
All of our chart libraries can be used with any backend database or server stack. Provide any form of data, including CSV, JSON, or real-time loading and updating. Highcharts or our community provides packaging for most popular languages (such as. Net, PHP, Python, R, and Java, as well as iOS and Android) and frameworks such as Angular, Vue, and React.
- TypeScript
Due to the integration declaration of TypeScript, the Highcharts NPM package allows for type checking of most Highcharts options and features, including autocomplete code and integration documentation for TypeScript supported editors such as Visual Studio Code.
- Options are optional
In most cases, the appearance and behavior of the chart fully meet your needs and do not require any modifications. A simple option structure allows for deep customization and can be styled through JavaScript or CSS. Highcharts can also be extended and inserted for experts seeking advanced animation and features. View some advanced customizations in our community section and check out plugins in our extension directory.
- Timely response
The intelligent response capability can not only adjust the chart according to the size of its container, but also automatically adjust the chart to place non graphical elements (such as labels, legends, and titles) in the best position.
- Support multi touch
Multi touch gesture support provides a native experience on both mobile and touchscreen devices. Touch gestures include single touch dragging data checking, multi touch zooming, etc.
- note appended
Through annotations, developers can describe charts or data points by drawing or linking them to simple shapes and text of specific data points at any position on the canvas. Alternatively, the annotation module includes an API for building user interfaces such as buttons, toolbars, and dialog boxes, allowing end users to place their annotations on charts. The position and visibility of annotations intelligently respond to the size of the canvas/screen at runtime.
- Accessibility and Audibility
Highcharts provides an accessible interactive chart solution for people with disabilities. Each Highcharts license includes our accessibility modules and flexible audible APIs. The accessibility module allows you to create charts that are as easy to access as possible, while the audible API helps you bring data to the world of sound in multiple ways. Visit our accessibility portal to learn more information.
- Data processing in browsers
By using Highcharts, source data can be post processed in the client to improve user experience. An excellent data processing feature is the ability to sort data, regardless of whether the data source has been sorted or not.
- Big data ready
When you need to render thousands of data in your browser, our WebGL driven acceleration module provides incredible speed.
- Export and Print
After enabling the export module, users can click the button to export charts to PNG, JPG, PDF, or SVG formats, or print charts directly from web pages.
- debugger
Highcharts debugger helps you speed up development by providing real-time warnings and error reports above the charts. The error message will provide clear instructions on how to solve the problem.
- Available sources
Download the source code as needed for editing. Trying this code does not require a license. When you are ready to use the software for commercial projects, you must have the appropriate license. Please browse our store for more information.

Official website: https://highcharts.com.cn/products/dashboards
Download Center: https://highcharts-dashboards.apsgo.cn
Backup Download: N/A
Delivery time: manual processing
Operating Platform: Web
Interface language: Supports English interface display.
Update note: The annual license grants you the time limited right to use the applicable version of the software published during the valid subscription period; A perpetual license grants you the right to use the applicable major version of the software specified in the license statement at the time of purchase.
Pre purchase trial: Free trial is available before purchase.
How to receive goods: After purchase, the activation information will be sent to the email address at the time of placing the order, and the corresponding product activation code can be viewed in the personal center, My Orders.
Number of devices: N/A
Replace computer: N/A
Activation guide: To be added.
Special note: To be added.
reference material: https://highcharts.com.cn/shop/

Any question
{{ app.qa.openQa.Q.title }}


